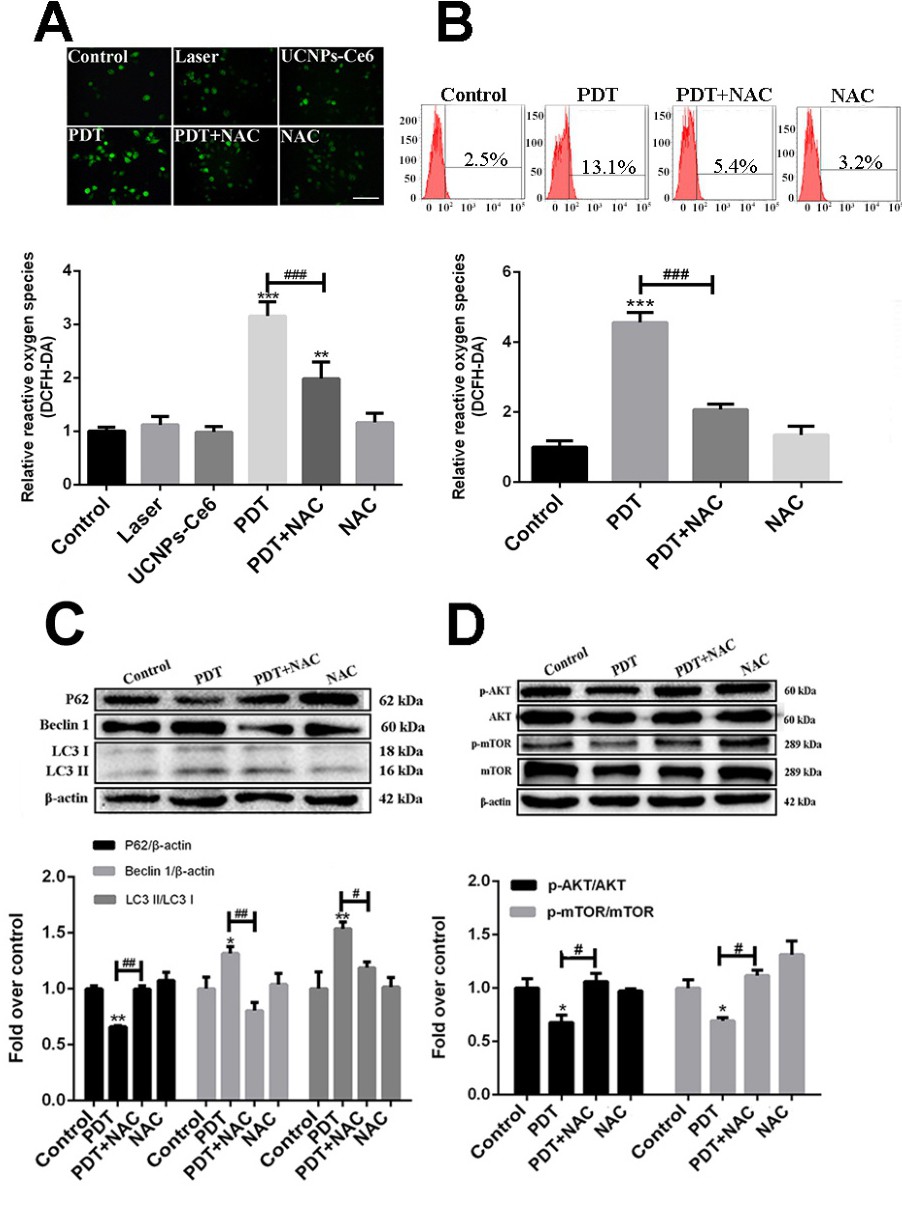
Fig. 6. ROS generated by PDT induced autophagy via the PI3K/AKT/mTOR signaling pathway. (A) Intracellular ROS generation of M1 peritoneal macrophages measured by DCFH-DA staining (scale bar: 50 µm) (n = 10). (B) ROS generation measured by flow cytometry (n = 7). (C) Western blotting analysis of the expression levels of p62, Beclin1, and LC3 II/LC3 I at 2 h after PDT (n = 3). (D) Expression levels of p-AKT, and p-mTOR after PDT were analyzed by western blotting (n = 3). * P<0.05, ** P<0.01, *** P<0.001 vs control group, # P<0.05, ## P<0.01, ### P<0.001 vs PDT group.